


| 加工定制 | 是 |
|---|---|
| 用途 | 考古探宝仪 |
| 类型 | 金属探测器 |
| 重量 | 0.8(kg) |
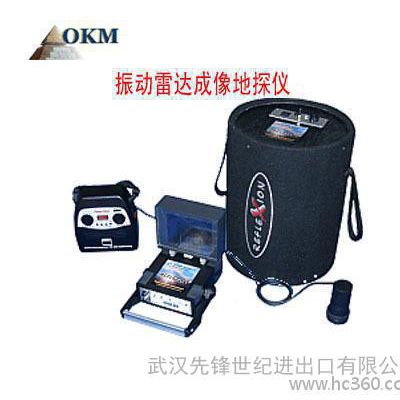
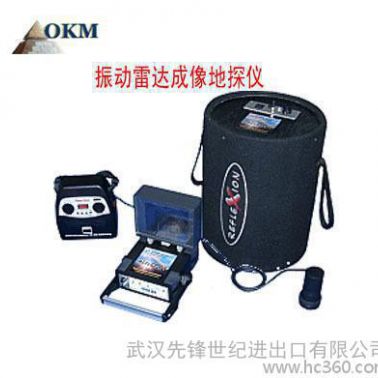
| 品牌 | 德国OKM振动雷达成像地探仪 |
| 型号 | 德国OKM雷达成像仪 |
中文简介:
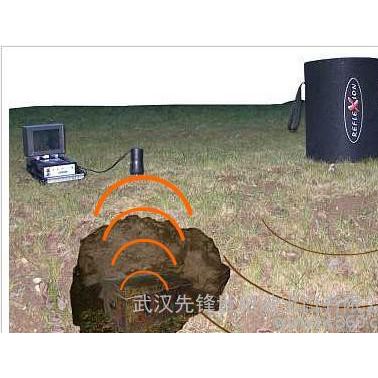
利用振动地下的结构的地球物理学测量方法,相似的空洞能被探测。 灵活的程序震动将会进入地面之内被产生而且传输期间。 运行时间和震动均被记录。 依照土壤条件标准的数据探测隐藏的物体。
FS是探测地下的像洞,燃料库的空洞,隧道或地下室窖的一个地球物理学的测定器具。 FS是由地震的震动工作原理。 一个发射器产生讨论地面的震动。 仰赖土壤的类型他们将会被传输或湿气。 如果空虚存在,它将会开始在它自己的频率方面共呜和能被一个地震震动转换器发现。 FS能在世界各地均可使用, 在无障碍的地面,沃土或泥土土壤, 在山区或平原的地区。
FS包括不同的操作模态记录并且分析数据:
检查模态认识地震的曲线。
扫描模态为图解式的表现记录测量价值
频率-能源-曲线图分析地震的活动
数据在 3D立体中为图解式的表现转移到计算机
被记录的测量价值能在经由频率被分析-能源-曲线图。 在特定的频率这一个图表和一个大的开阔的地面显示现有的地下空洞。 另外地概述对 3D立体表现的所有测量价值是可能的,所以他们能在专业的视觉型的人 3D立体软件被分析。 那样,空虚能够不但视觉上被表现 , 而且 , 他们的大小能被决定。
英文简介:
With the geophysical measurement methods of seismics underground structures like cavities can be explored. During that active procedure vibrations will be generated and transmitted into the ground. Resulting from that process reflexions, travel time and vibrations can be recorded. According to the soil conditions the measured data gives clues to hidden objects.
FS-Reflexion is a geophysical measuring instrument to locate subterranean voids like caves, bunkers, tunnels or basement vaults. FS-Reflexion works with a seismic vibration system. A transmitter generates vibrations going into the ground. Depending on the type of soil they will be transmitted or damped. If a void exists it will start to resonate in its own frequency and can be detected by a seismic vibration transducer. FS-Reflexion can be used all around the world, no matter if there is stony ground, loam or clay soil, in the mountains or in flat country.
FS-Reflexion includes different operating modes to record and analyse data:
Check Mode to recognize seismic disturbances
Scan Mode to record measurement values for a graphical representation
Frequency-energy-graph to analyse seismic activities
Data transfer to computer for graphical representation in 3D
The recorded measurement values can be analysed via the frequency-energy-graph. In this diagram a high amplitude at specific frequencies indicates existing subterranean voids. Additionally it is possible to summarize all measurement values to a 3D representation, so that they can be analysed in the professional Visualizer 3D software. In that way voids cannot only be represented visually, but also their size can be determined.
